System monitoring dashboards are something we are often asked to provide for our clients. Normally, this is a pretty straight forward task, but on a recent client engagement, I was presented with one requirement that was a bit out of the ordinary. This client was looking to monitor a set of ten desktops with a real-time dashboard that would display in their office. They wanted to see all of the standard metrics like cpu, memory, and disk. If there was a spike in a time chart for say % CPU Usage, they wanted to be able to click on the spike and drill down into another view. They wanted the...
OH NO!! Splunking log files with multiple formats?? No problem!
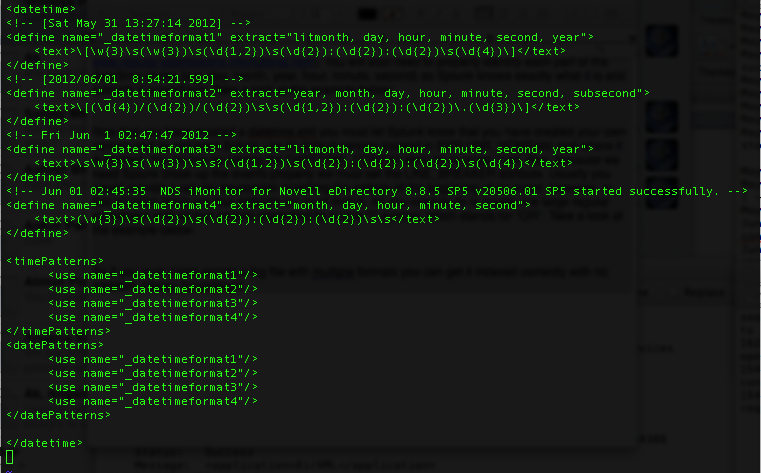
I was recently at a client site for a two-week engagement assisting them with ramping up their Splunk installation, and I came across something particularly interesting. One of the log files the client wanted to index in Splunk contained four different log formats with four different timestamps. Take a look at a sample of the log:
The Seven Dwarfs of Data On-boarding in Splunk
In my time working with and using Splunk, I have learned a few tricks and tips to make the Splunk experience even better. This post assumes you are familiar with a few Splunk keywords. If you are having trouble following along, take a look at this link and look up the terms: http://docs.splunk.com/Splexicon. If you have never seen Splunk before, I suggest taking a look at the Splunk Tutorial to familiarize yourself with the product: ...