System monitoring dashboards are something we are often asked to provide for our clients. Normally, this is a pretty straight forward task, but on a recent client engagement, I was presented with one requirement that was a bit out of the ordinary. This client was looking to monitor a set of ten desktops with a real-time dashboard that would display in their office. They wanted to see all of the standard metrics like cpu, memory, and disk. If there was a spike in a time chart for say % CPU Usage, they wanted to be able to click on the spike and drill down into another view. They wanted the...
OH NO!! Splunking log files with multiple formats?? No problem!
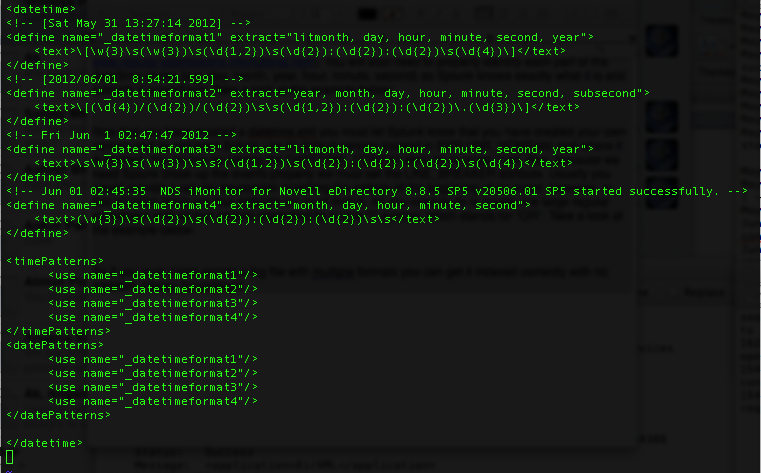
I was recently at a client site for a two-week engagement assisting them with ramping up their Splunk installation, and I came across something particularly interesting. One of the log files the client wanted to index in Splunk contained four different log formats with four different timestamps. Take a look at a sample of the log:
Analyzing the word Analytics in an ever-increasing Analytical world
As you can tell from the preposterous article title, I take exception to the use, overuse, and misuse of the word Analytics. From the day the first person uttered this word, the word has taken on a life of its own. Analytics at a basic level simply means to distill data so that some information/knowledge can be gleamed in the hopes of making better informed decisions in the business arena or any other for that matter. Early Analytics came in the form of a simple spreadsheet tool such as excel and was a means to do decision , what-if or scenario analysis. Spreadsheets can be used to perform...