Creating a Custom D3 Application with Visualizations in Splunk
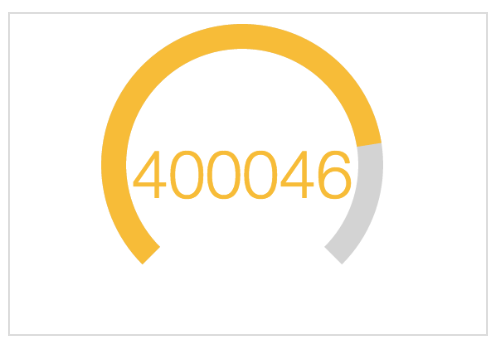
This is a slightly lengthy tutorial on creating your own D3 (or any other open source JavaScript library) visualization and app for use in Splunk. It assumes familiarity with creating Splunk Apps, as well as with JavaScript, and as such is at a more intermediate level: before creating this app, you might want to work on both your JavaScript skills and work on creating some Splunk visualizations with Splunk JS or Simple XML. You...


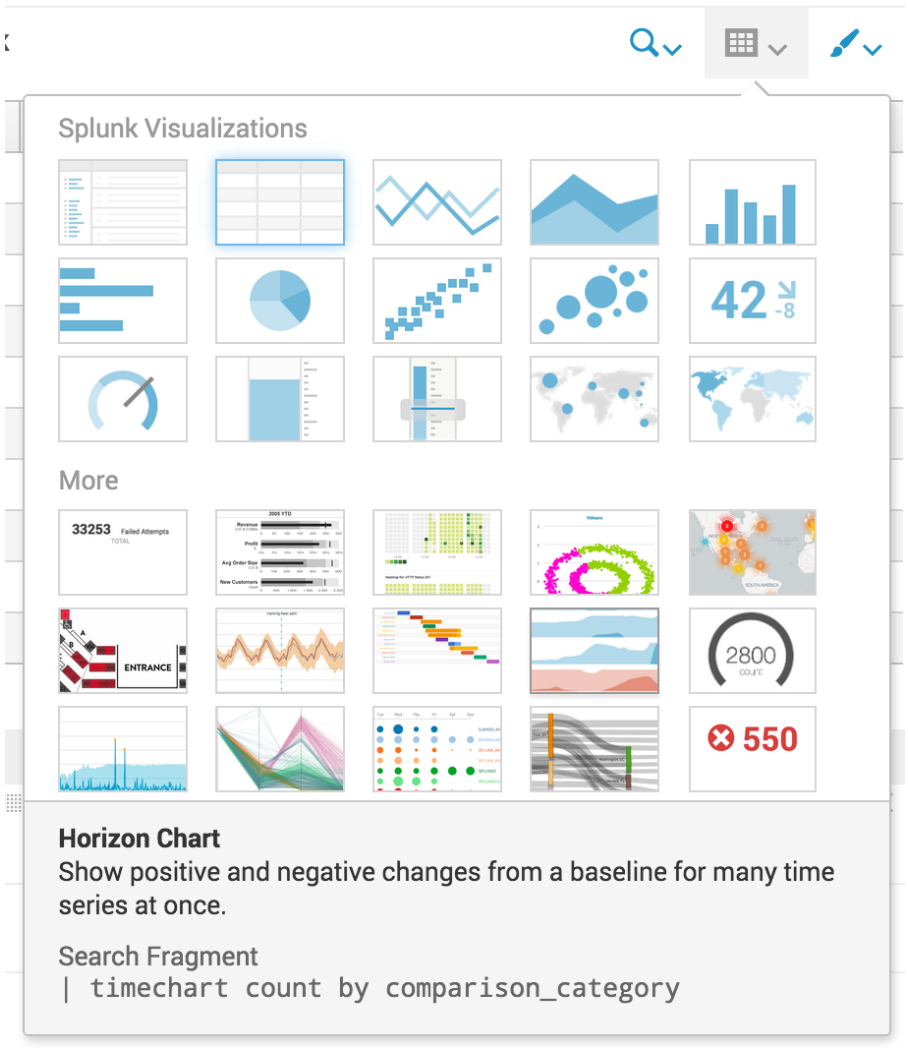
Creating and Using New Custom Visualizations in Splunk 6.4

Visualizations are not new to Splunk, whether XML or (D3) JavaScript, but the visualizations offered in Splunk 6.4 are the easiest and most powerful yet!

Splunk has four large improvements to visualizations:

  1. 12 New D3 Visualizations
  2. The ability to add and extend your own visualizations to the library
  3. Developer APIs...

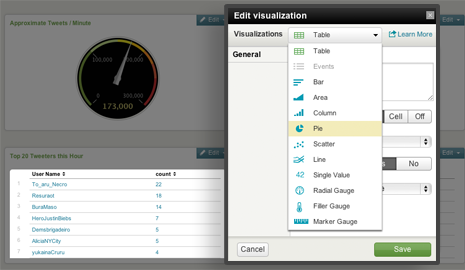
Using the Visualization Editor to Create a Dashboard in Splunk 4.3

Hello world!  This is my first blog post with Function1 and I hope you find it useful. This post will give you an idea of how simple it is to use the new Visualization Editor in Splunk 4.3 to create a dashboard. This neat new feature is great because it simplifies the dashboard and panel creation process by allowing any user to create a custom dashboard without having to write any XML code and/or book time and consult with the IT guy! Each Splunk user can create their very own custom dashboard with panels that can include a table, pie chart, line graph, or a variety of other options with...


Stay In Touch