Event Sampling - Splunk 6.4 Feature


When I am at client sites I often get asked how they can get a better understanding of what is going on in their Splunk environment. A recent client wanted to understand what dashboards were being used the most in their environment and who were the top users. What a great thought! I knew that Splunk had to have a way to track this. It was just a matter of locating the data and then determining the best way to pull it. After going back and forth between metadata and the internal index, I came across this in Splunk’s internal index.
...
Recently, I had the opportunity to work on the Web Analytics portion of an internal app development project. As a newb, I was eager to jump in, get started, enjoy the adventures and misadventures of Splunking, and put to use my newly developed Splunk skills obtained from weeks of training. I mean how could I fail? I had the right people, processes, and technologies supporting me to jump in and start the Splunk magic.
Moving forward, I jumped into action by reading tons of documentation, asking the typical newb questions and making the typical newb mistakes until somehow the first...

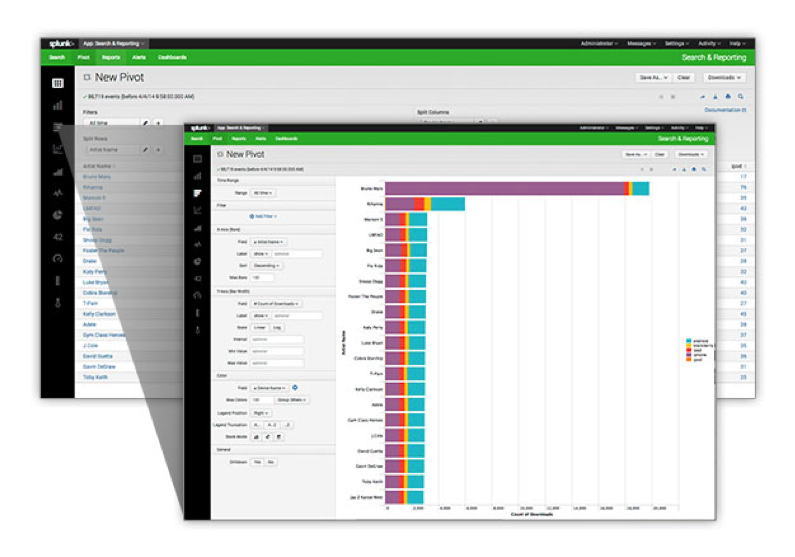
Data models were introduced with the release of Splunk 6 back in Oct of 2013. By now, Splunk users are aware of the pivot feature that allows them to build various types of reports that are fueled by data models without having to know the Splunk Search Processing Language (SPL). The Pivot Editor is a great way to build these reports, it allows users to simply point and click their way to creating reports/charts/graphs that provide great insight. This feature is great for users that only want to use the Pivot Editor to create their reports. However, you cannot add the Pivot Editor to a...

Welcome Splunkers! I hope everyone is having a great New Year. We certainly are, here at Function1. We just publicly released a beta version of our Splunk for Oracle WebLogic Server app to Splunkbase as mentioned in a recent post. As part of the Splunk products team at Function1, I'm always looking at new ideas and approaches in Splunk app development. As Splunk apps become more robust, they will...

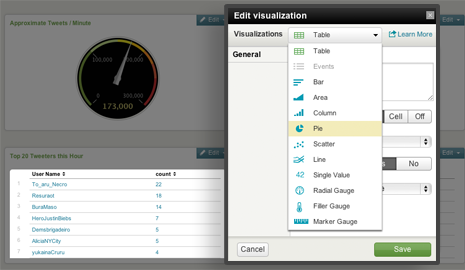
Hello world! This is my first blog post with Function1 and I hope you find it useful. This post will give you an idea of how simple it is to use the new Visualization Editor in Splunk 4.3 to create a dashboard. This neat new feature is great because it simplifies the dashboard and panel creation process by allowing any user to create a custom dashboard without having to write any XML code and/or book time and consult with the IT guy! Each Splunk user can create their very own custom dashboard with panels that can include a table, pie chart, line graph, or a variety of other options with...

(Image: Salvatore Vuono / FreeDigitalPhotos.net)
This is hopefully the first in a series of posts dealing with the joys of developing dashboards and apps in Splunk. In this post, I’d like to highlight different development options and introduce SideView Utils.
The Case for Dashboards
Organizations use Splunk in a variety of ways. Uses range from monitoring a specific application to gaining enterprise-wide insight into their operations. Insight can be...
