Macros and Tokens: Getting the Best Use of Them

While at a client recently, I had the task of creating a dashboard with the ability to look at Linux and Windows data's highest points and averages. The Windows and Linux data needed to be viewed separately, but still have the ability to view the data in total. To accomplish this, I created a base search using six macros: two to encompass both operating systems with each calculation mode, and two per operating system for each calculation mode.My first step was to create the macros. This is done by Settings > Advanced Search > Search Macros. Once at this page, click “New”. You will be...


Creating my first dashboard and adding interactivity: The magic of text boxes in Splunk 6.1* in Simple XML

Recently, I had the opportunity to work on the Web Analytics portion of an internal app development project. As a newb, I was eager to jump in, get started, enjoy the adventures and misadventures of Splunking, and put to use my newly developed Splunk skills obtained from weeks of training. I mean how could I fail? I had the right people, processes, and technologies supporting me to jump in and start the Splunk magic.

Moving forward, I jumped into action by reading tons of documentation, asking the typical newb questions and making the typical newb mistakes until somehow the first...


Using the Visualization Editor to Create a Dashboard in Splunk 4.3

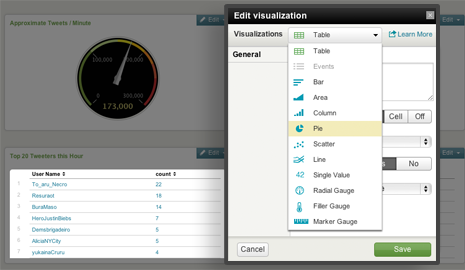
Hello world!  This is my first blog post with Function1 and I hope you find it useful. This post will give you an idea of how simple it is to use the new Visualization Editor in Splunk 4.3 to create a dashboard. This neat new feature is great because it simplifies the dashboard and panel creation process by allowing any user to create a custom dashboard without having to write any XML code and/or book time and consult with the IT guy! Each Splunk user can create their very own custom dashboard with panels that can include a table, pie chart, line graph, or a variety of other options with...


Stay In Touch