Function1 Announces Sponsorship of .conf2015

Function1 today announced it is a Giga sponsor of .conf2015: The 6th Annual Splunk Worldwide Users' Conference. .conf2015 will feature more than 165 sessions, including more than 80 customer presentations, and is expected to attract thousands of IT, security and business professionals who know the value of their data. The conference will be held September 21 – 24, at the MGM Grand Las Vegas, with three days of optional education classes through Splunk University®, September 19 – 21, 2015.

Longtime Splunk partner and one of...


Introduction to Drupal 7 Maps - Leaflet

This is my second post in the Drupal mapping series. Introducing Leaflet! 

In my previous post I described the steps to create a map in Drupal using OpenLayers. Since that post was published the OpenLayers Drupal module has been completely rewritten. The current stable 3.x release is beta3. While this is a stable release, the module is still under heavy development. This gave me the...


Being Unique is All About Being Different

Unique: (adjective) Existing as the only one.

Being unique is something we strive for, to be the only one of “us”. Wouldn’t you like for your Splunk app to be the same? For customers to use your app and see your color, your logo, your complete customization.


Here is my app, F1 Demo, as “bare bones” or basic.

First we’ll change...


Challenges in Creating a Project Management Office

Last time we talked about why a Project Management Office can be vital to the success of your organization. Today, we’ll highlight some of the challenges in creating a Project Management Office and how to help overcome them.


So what roadblocks can one hit when trying to create a PMO? To name a few:

PMO is not Empowered to Make Needed Decisions

...

Adding D3 Visualizations to Splunk Dashboards

Introduction

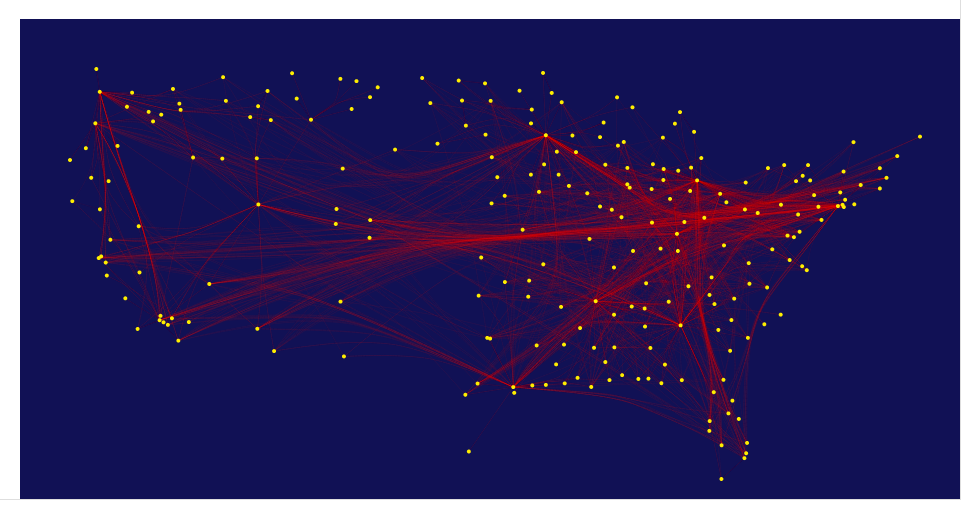
In this post I would like to cover how to add some really great visualizations to a dashboard in Splunk.  I will cover how to use D3.js, a third-party javascript visualization library, and Splunk's JS stack. 

D3.js (or just D3 for Data-Driven Documents) is a “JavaScript library that uses digital data to drive the creation and control of dynamic and interactive graphical forms which run in web browsers." (http://d3js.org/)   In this post we'll cover how to add a D3ChartView control to a Splunk dashboard. 

...

Stay In Touch