Posted by Rick Ptasznik
on Tuesday, December 6, 2016 - 06:27
Web Experience Management WebCenter Sites, attribute editors, UI, Customizations, dojo
The Sites 12c documentation has some instructions and examples of setting up a custom attribute editor, but they don't get very complicated. I wanted to add some functionality to the built in editor for picking an asset and realized there are a lot of steps so blogging about it might be usefull for others. Building UI enchancements can feel like putting together a puzzle for the first time. This won't show a full working example but I'll point out all the files and key things that had to be done to add a button next to each selected attribute whether or not the attribute is set to single...
Say my name, say my name...
Posted by Neena Bhutiani
on Friday, August 30, 2013 - 14:46
Operational Intelligence, Best Practices Best Practices, Splunk, UI
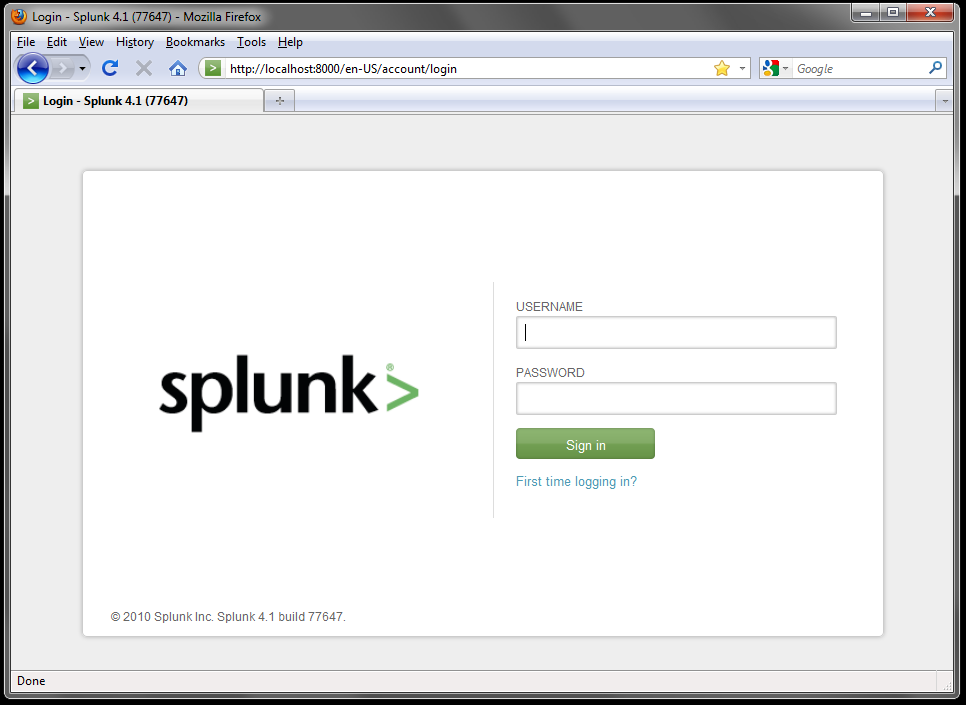
As a consultant, I get asked this question from my clients all the time. They use Splunk everyday and when they log in they see this screen:
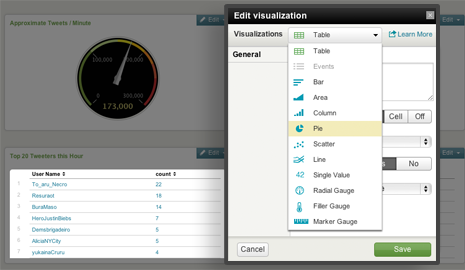
Using the Visualization Editor to Create a Dashboard in Splunk 4.3
Posted by Rupak Pandya
on Thursday, April 5, 2012 - 16:09
Operational Intelligence, Cool Tools Analytics, Cool Tools, Dashboards, Simple XML, Splunk, UI, Visual, Visualization
Hello world! This is my first blog post with Function1 and I hope you find it useful. This post will give you an idea of how simple it is to use the new Visualization Editor in Splunk 4.3 to create a dashboard. This neat new feature is great because it simplifies the dashboard and panel creation process by allowing any user to create a custom dashboard without having to write any XML code and/or book time and consult with the IT guy! Each Splunk user can create their very own custom dashboard with panels that can include a table, pie chart, line graph, or a variety of other options with...