Introduction
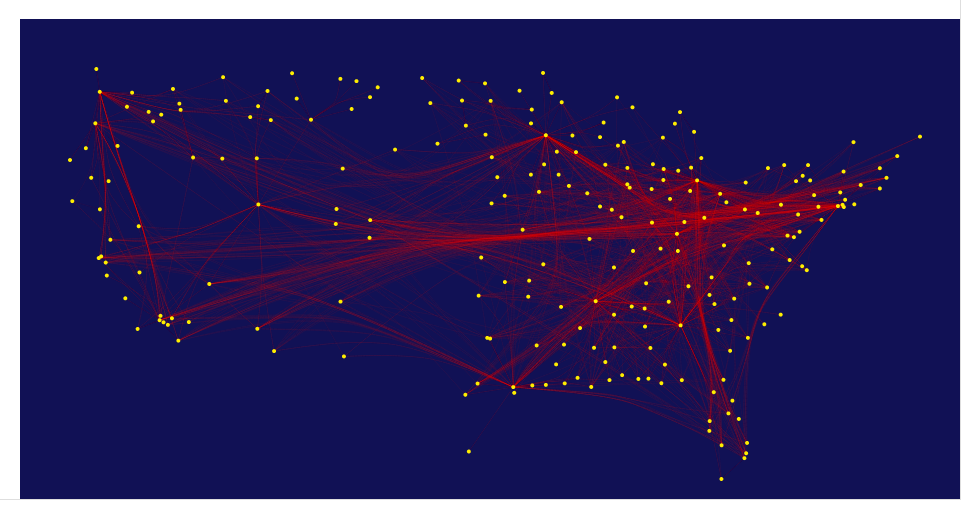
In this post I would like to cover how to add some really great visualizations to a dashboard in Splunk. I will cover how to use D3.js, a third-party javascript visualization library, and Splunk's JS stack.
D3.js (or just D3 for Data-Driven Documents) is a “JavaScript library that uses digital data to drive the...


